 SynthMaker
Watch your sound
See what you hear. The XY Plot draws one sound against another as a shape of light, and a Screen shows it big. The Analyzer shows a sound's wave and its frequencies as it plays.
Pro: anyone can open any module and read its code, parts list or patch. Writing your own, or changing one, needs SynthMaker Pro. Turning its knobs is free. Adding a Screen, an XY Plot or shader art is part of SynthMaker Pro too; sounds made with them, such as Circle and Knots, open and play for everyone, and the Analyzer is free.

New words
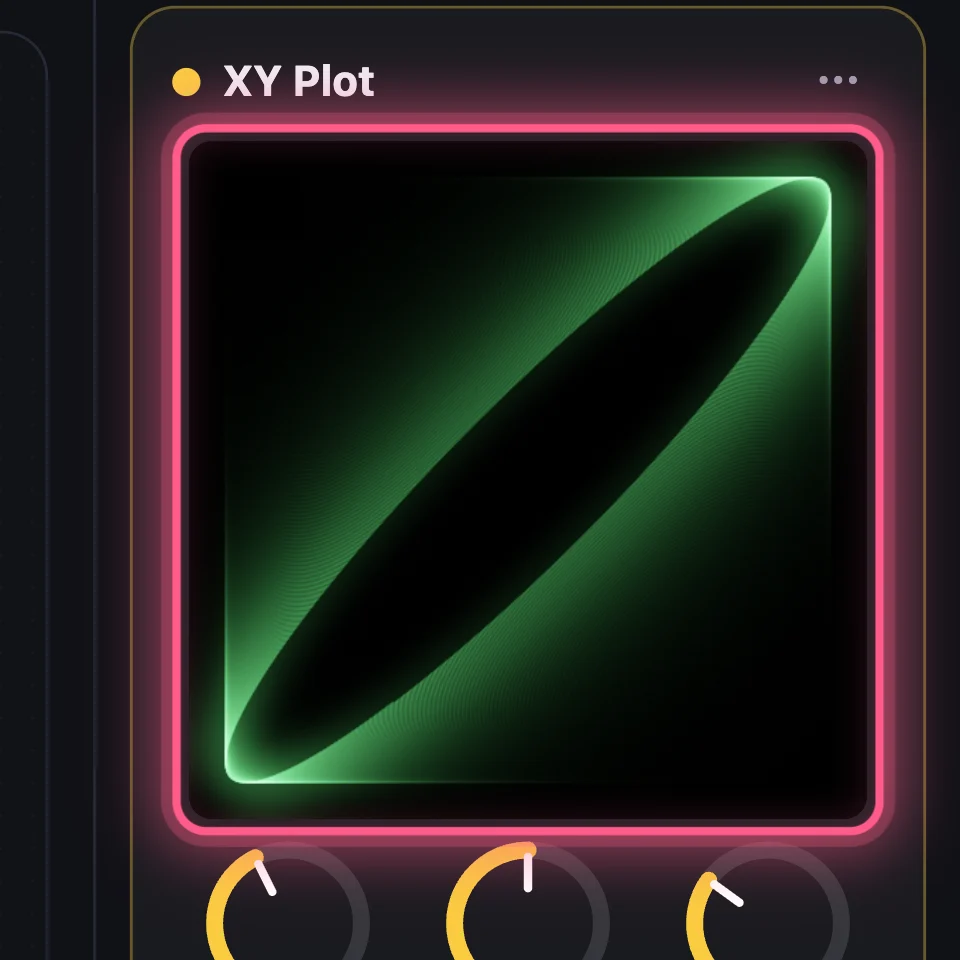
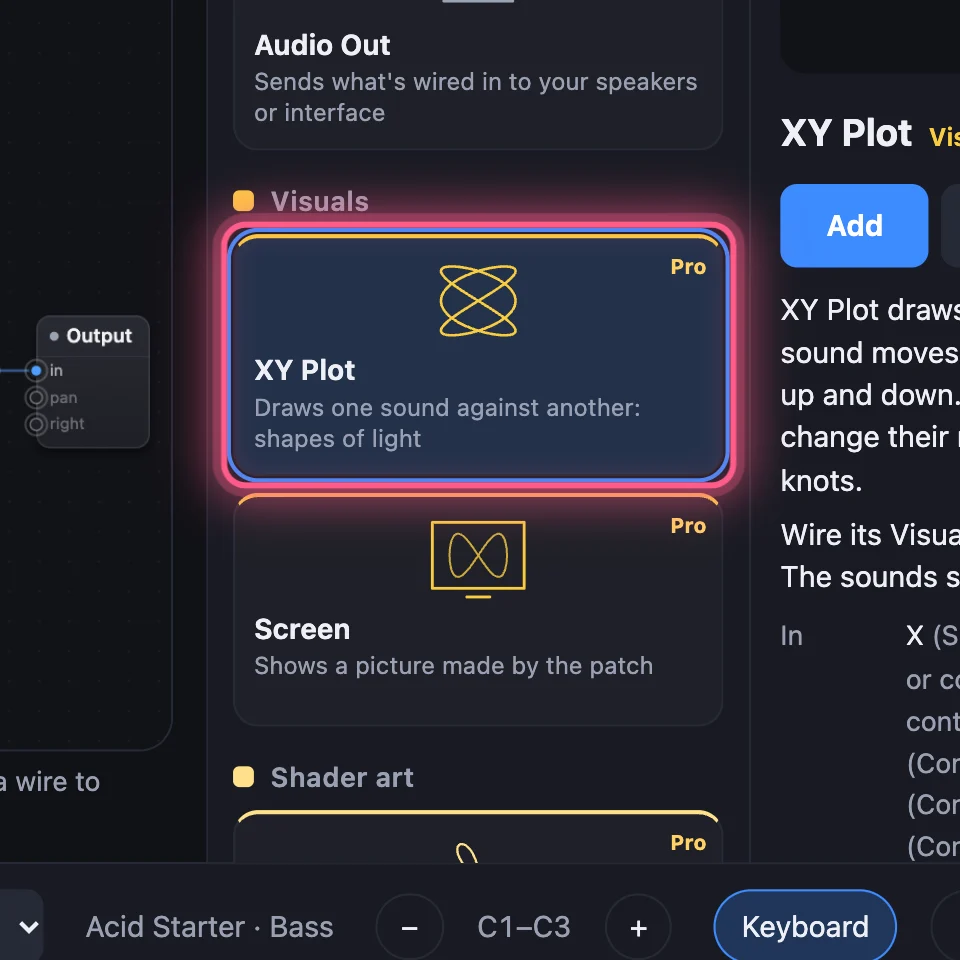
An XY Plot is a beam of light that one sound moves left and right and another moves up and down.
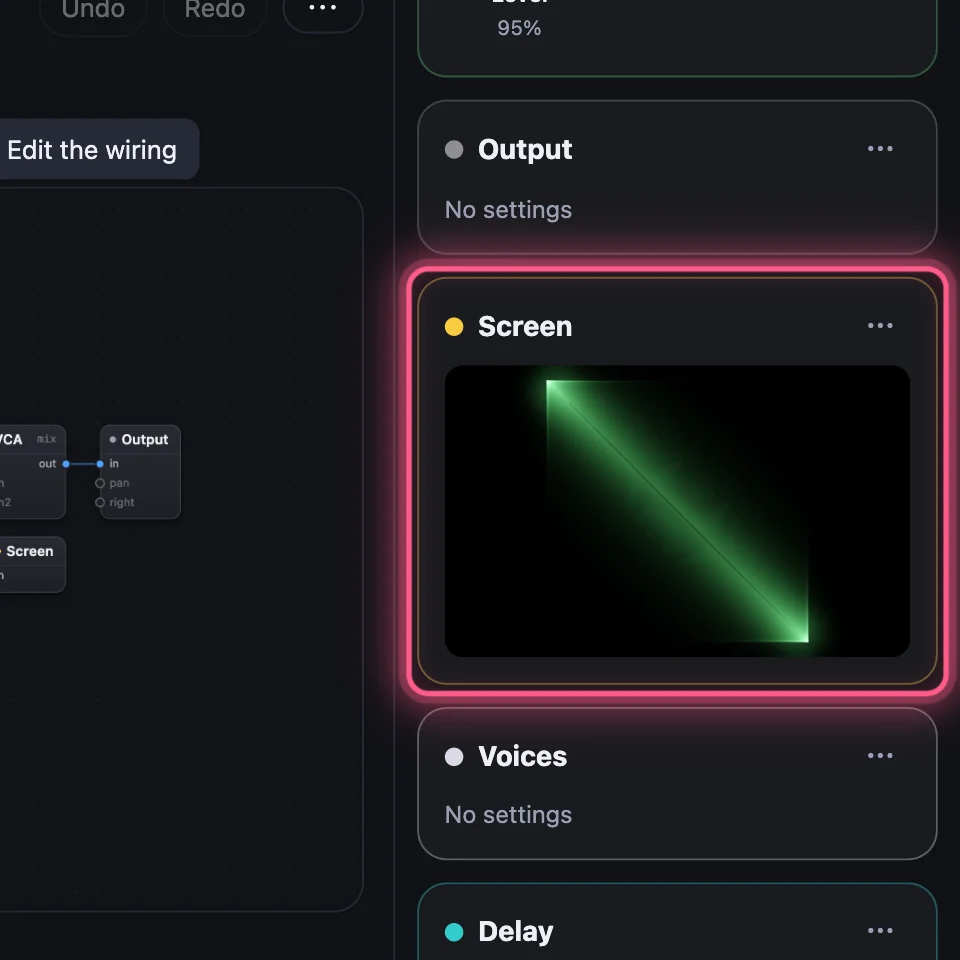
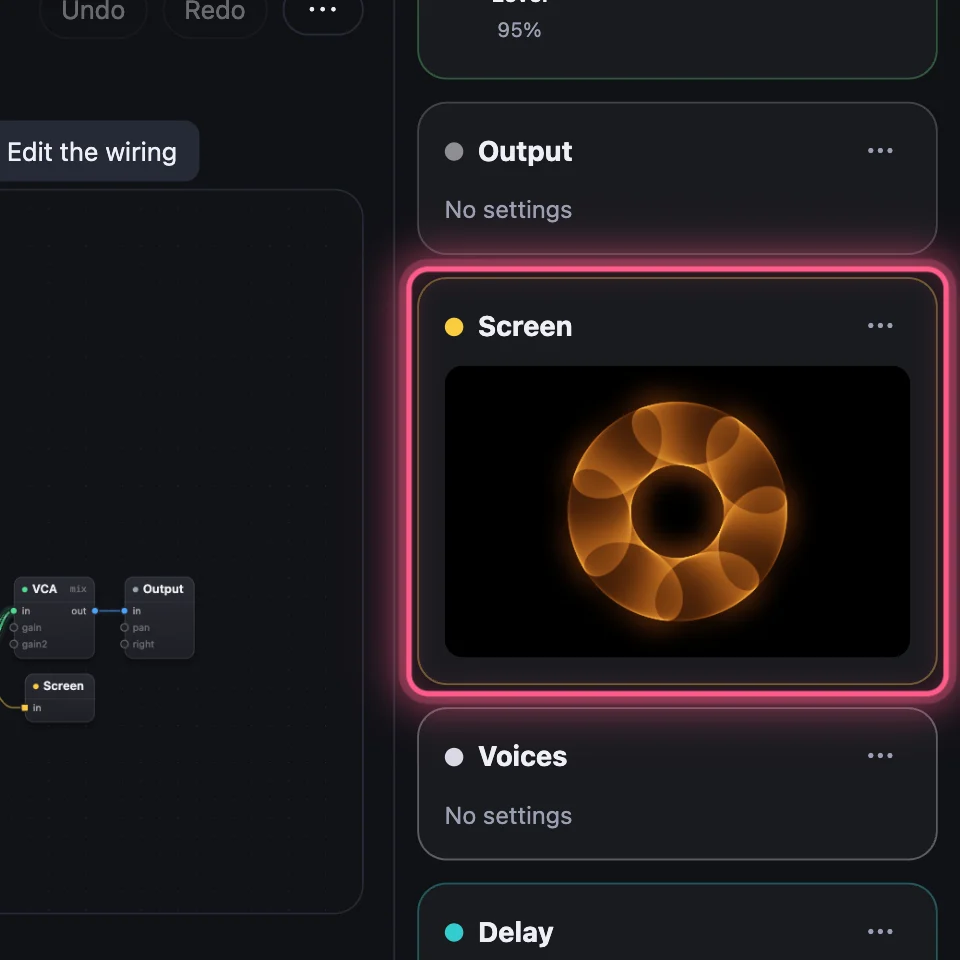
A Screen shows the picture wired into it, big: an XY Plot's light, or a shader pattern.
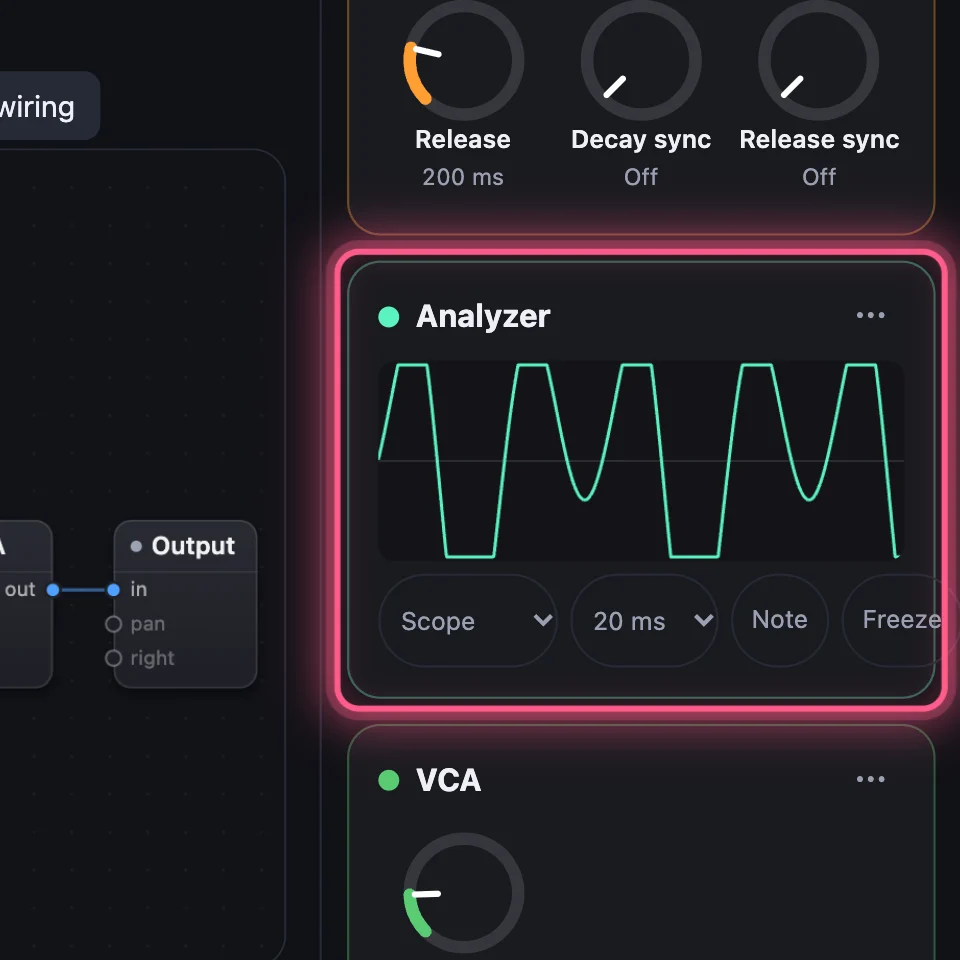
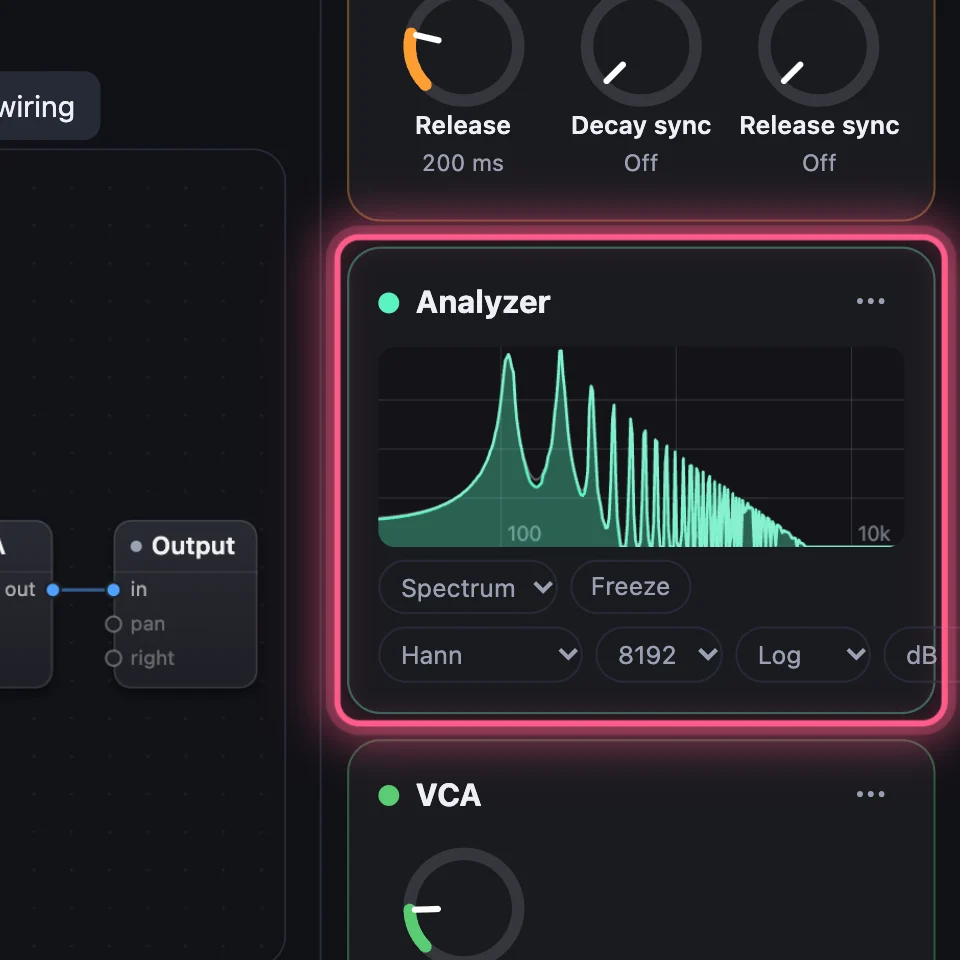
An Analyzer passes the sound through untouched and shows it: its wave, or its spectrum, the sound's frequencies from low to high.
1The XY Plot's light
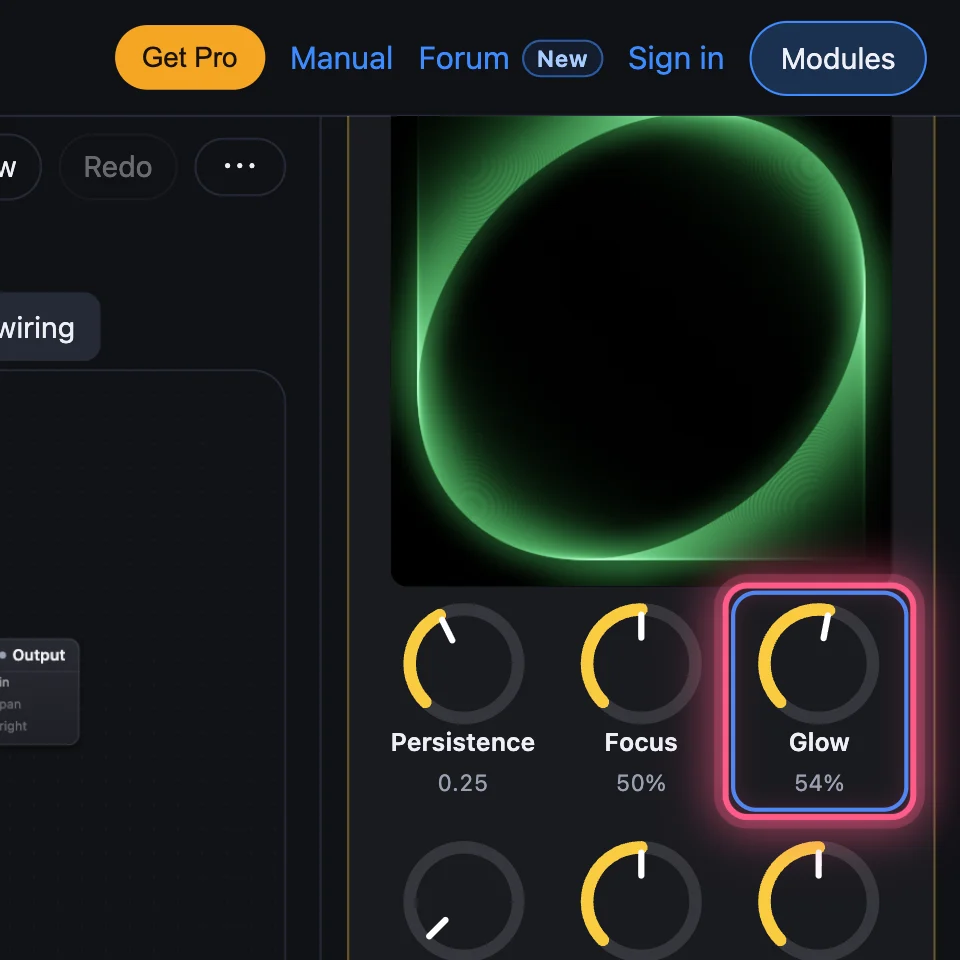
An XY Plot draws a beam: one sound moves it left and right, another up and down. Two sines make a circle; change their ratio and it ties itself in knots. Its card shows the light as you play, on the web and the Mac. Open Circle and Knots and hold a note.
2Big, on a Screen
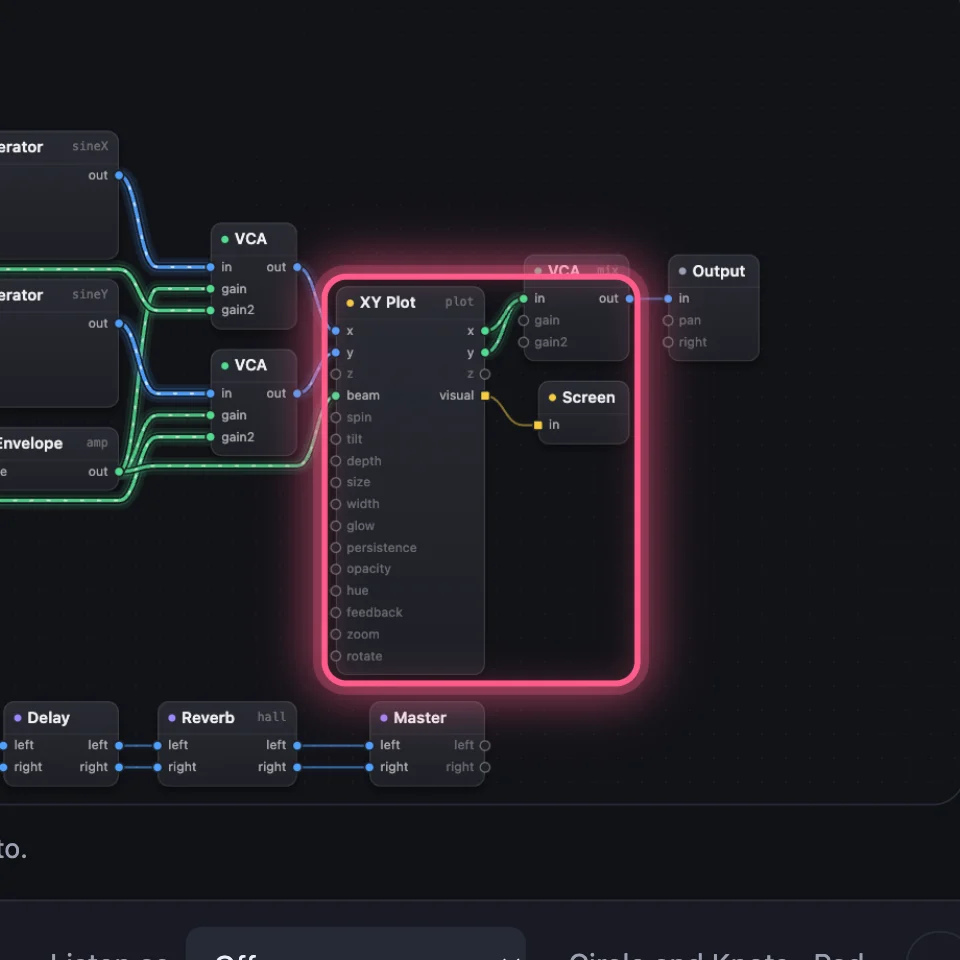
Wire the XY Plot's visual into a Screen and the Screen shows its light, big. The wire is what decides which plot a Screen shows.
3The Analyzer
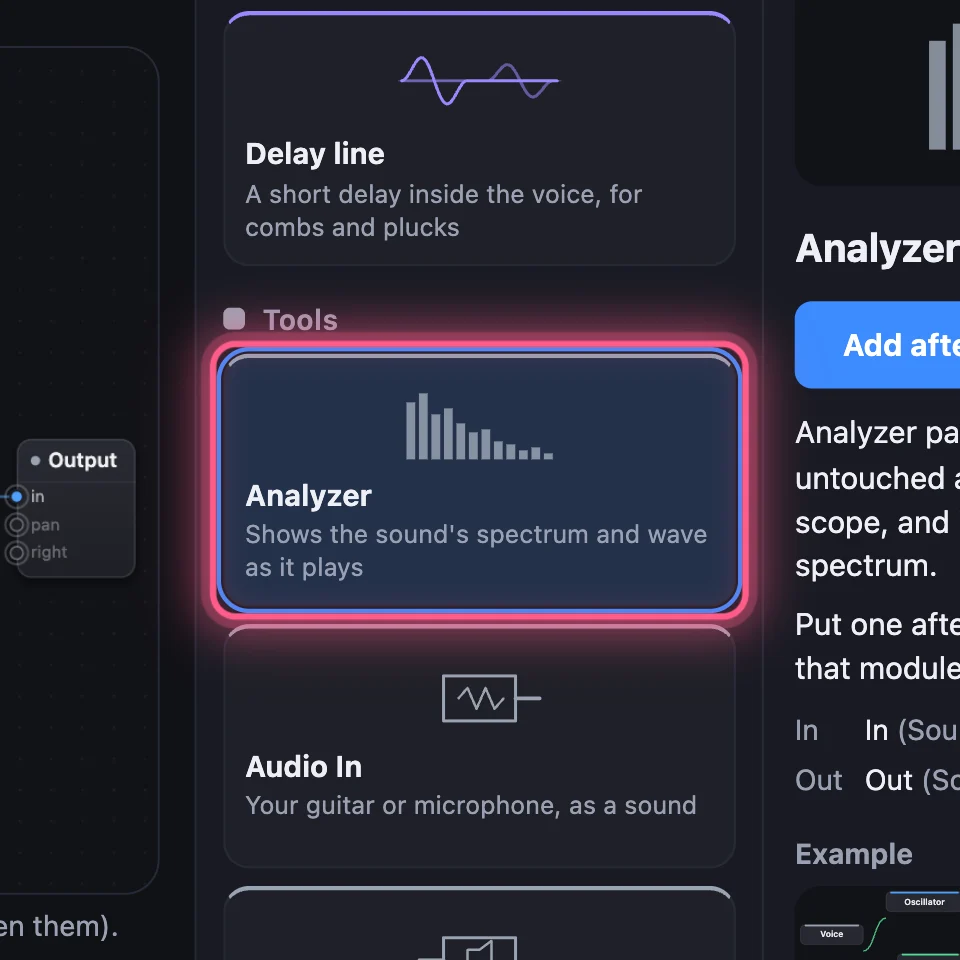
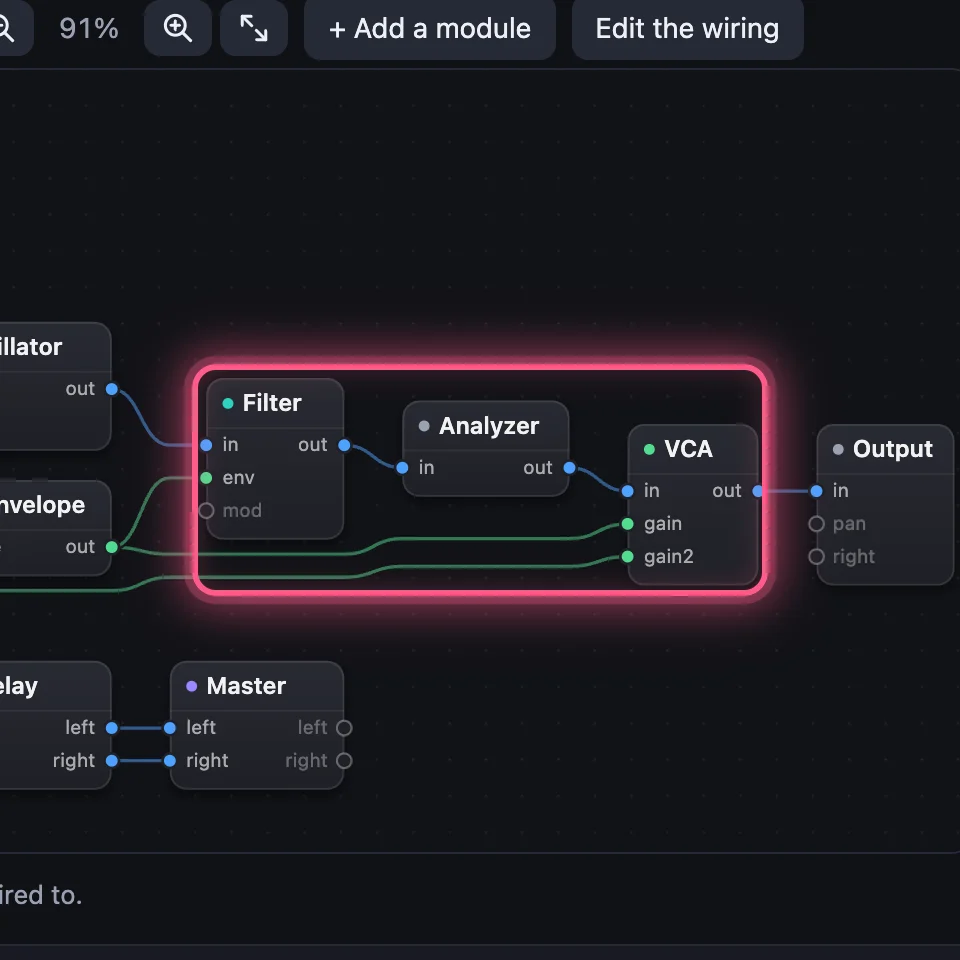
Click a module, then + Add a module, and add Analyzer from Tools. It goes after the module you chose. Play, and its card shows the wave (Scope). Switch it to Spectrum to see the frequencies: turn the Filter's Cutoff and watch the highs fall away. Freeze holds the picture still, and Compare draws another Analyzer over this one, to see before and after a module.
Try it
- Open Circle and Knots and hold a note: its card draws the figure, and so does its Screen.
- Turn the XY Plot's Glow and Persistence: the light blooms, and the trail lasts longer.
- Open Acid Starter, click the Filter, then + Add a module, Analyzer, hold a note and switch it to Spectrum.
On the Mac, the XY Plot draws on its card the same way. Click Visuals in the toolbar and a Screen's figure fills a window of its own, which you can drag to a second display and make full screen.
Remember
- The XY Plot draws one sound against another, on its card; wire its visual into a Screen to see it big.
- Only the first two XY Plots in a sound draw, for the sound you're editing.
- The Analyzer passes the sound through and shows it: Scope for the wave, Spectrum for the frequencies.